By default, Kubernetes use the Calico CNI plugin to allocate network interfaces for the containers within the pod. The result is one network interface within the container. For use cases, such as routing, packet forwarding, content based routing , the container needs more than one interface for its CNF realization. With Multi plugin, this feature can be achieved.
Architecture Briefing
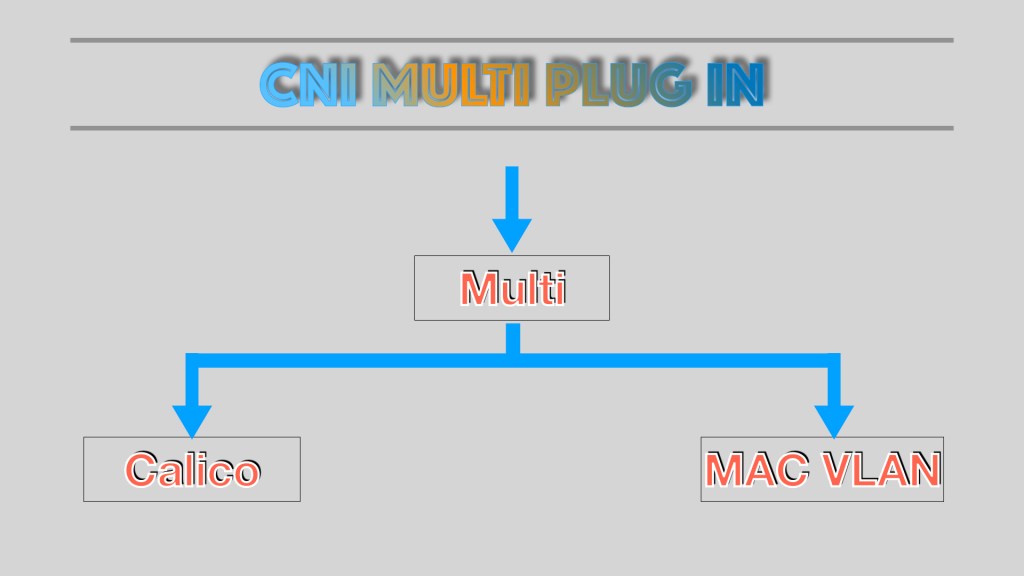
During pod initialization phase, CRI (Container Runtime Interface ) will call CNI (Container Network Interface) to allocate network interface for the container. The most used CNI realization is Calico and by this CNI, one network interface is allocated within the container. In order to achieve multiple network interfaces within the container, the solution is the multi plugin. The CRI calls the Multi plugin first, and then, Multi plugin call multiple CNIs backends to achieve multiple network interfaces within container as illustrates in following diagram:
In the above diagram, Multi called the Calico CNI and MAC VLAN plugin to create two interfaces inside the container.
Demo
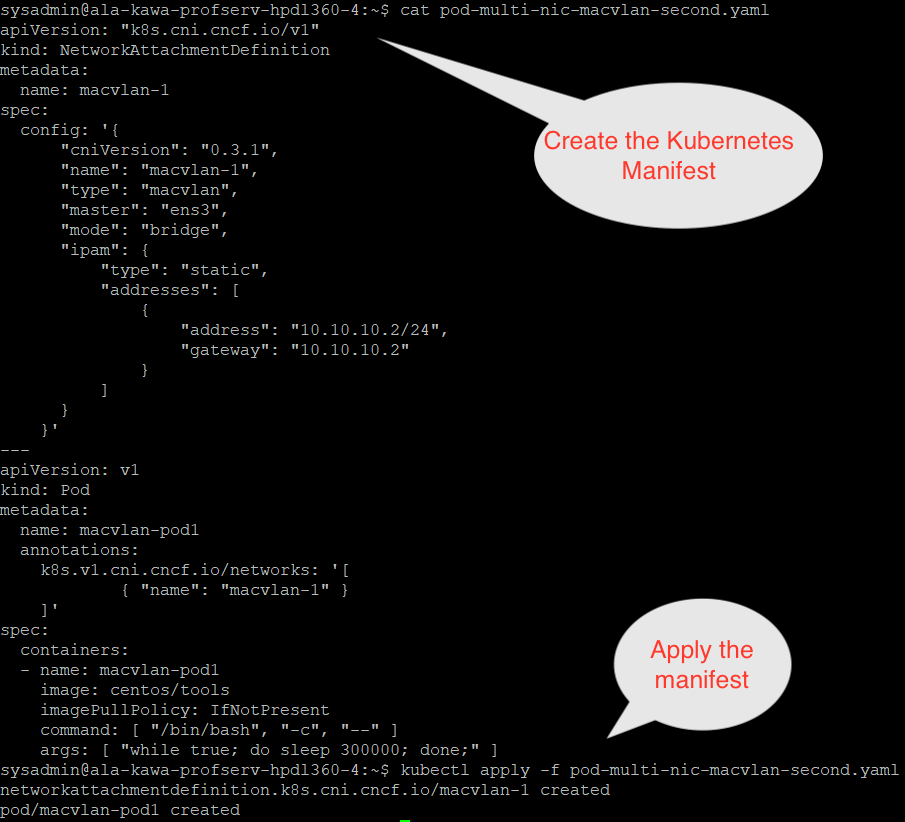
First create the NAD (Network Attachment Definition), then according K8s manifest, apply it in the cluster, wait for the pod to be launched successfully.
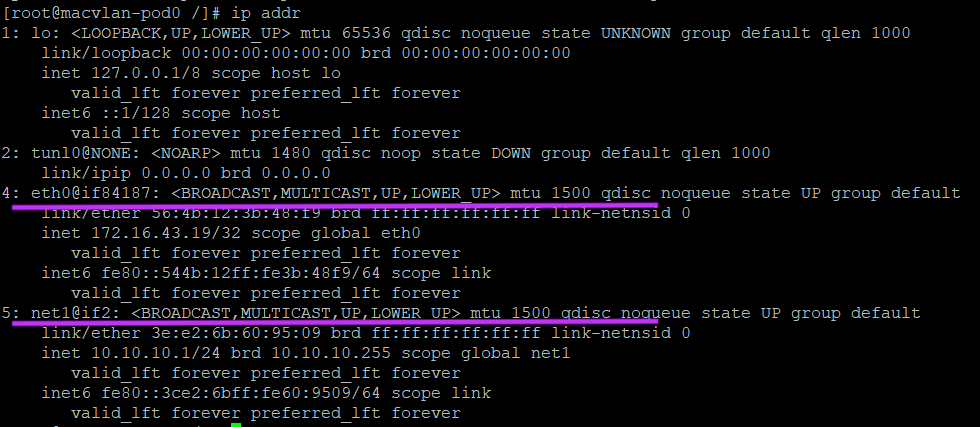
Then, attach to the launched pod’s container, examine the allocated network interfaces within the container. There are two interfaces allocated within the container: the first eth0 interface is allocated by the Calico CNI and the second network interface net1 is allocated by the MAC VLAN CNI. Both CNIs are called by the MULT Plugin during the container initialization phase.
When you digitized and moved your traditional application running on bare metal platform to the cloud in the form of a container, one drawback is the network performance degradation in the virtualized environment no matter what hypervisor you are using.
One way to keep the similar network performance is to use modern network interface card (NIC)’s: such as Intel X710 or Mellanox MT27700/27710 Family , SR-IOV feature: It divided the same physical NIC into multiple physical function (PF)s, and each PF can be further be divided into a couple of Virtual Function (VF)s. You can directly pass one or more of the VFs to a container to achieve the native network performance for the application running inside the container without the penalty associated with the hypervisor layer overhead. You can also utilize other network performance mechanism such as DPDK poll mode driver to further enhance your application’s network performance.
How does it work ?
For the Kubernetes cluster with Calico and Multi plugin, during the Container Network Interface (CNI) initialization phase, CNI configuration in Network Attachment Definition (NAD) format can be used to configure and set up SR-IOV resources.
Those processes are complicated and error-prone. Most popular, publicly available Kubernetes platforms, such as openshift, StarlingX, provided users with high level utilities to make those tasks easier. In openshift, there are a utility called “SR-IOV network operator” with following CRDs (Custom Resource Definition) : Sriov Network, SriovNetworkNodeState and SriovNetworkNodePolicy to do node NIC hardware feature auto discovery, initialization, provision, upgrade and initialization of CNI plugin with auto generation of NAD Customer Resource (CR) from declarative high level manifest. In the StarlingX open source solution, users can use system commands to achieve the same goal from a high level command line interface.
A Complete Working Flow Example
Now, let’s use an SR-IOV device in a containerized application with an working example on StarlingX platform:
First, find your available nodes ( especially worker node, which can host pod based applications ) by system node management command, find and lock the worker node with SR-IOV capable NIC card, assign sriov related label to the worker node, provision the parameters for the SR-IOV PF/VF related parameters as following steps:
~(keystone_admin)$ system host-list
~(keystone_admin)$ system host-lock worker-0
~(keystone_admin)$ system host-label-assign worker-0 sriovdp=enabled
~(keystone_admin)$ system host-if-list -a worker-0
~(keystone_admin)$ system host-if-modify -m 1500 -n sriov1 -c pci-sriov -N 16 --vf-drvier=vfio worker-0 ens0
~(keystone_admin)$ system datanetwork-add datanet-0 vlan

~(keystone_admin)$ system interface-datanetwork-assign worker-0 sriov1 datanet-0
~(keystone_admin)$ system host-lock worker-0
The above third system command assigns the sriovdp=enabled label to the worker-0 node to make it managed under the Multus and Calico plugin mechanism. After find the corresponding NIC (ens0 here, for example), the 5th command assign 16 VFs to it, with MTU value of 1500, gave it a new name: sriov1 and bound vfio driver to it, which will allow DPDK poll mode driver used in the pod, a netdevice driver can be used if a normal Linux network device driver is desired. Next command provision a VLAN type data network with name datanet-0. Data network is an abstract concept to glue physical network card entities with logical data network concepts. You can think of it as similar to the Linux Volume Group concept, and you can add logical volume residing on a physical disk device partition such as /dev/sda1 into the volume group. Here, datanet is an abstract concept like volume group and you can associate a specific NIC function ( such as a VF of an SR-IOV interface ) with the datanet. This is what the next command did. After all the configuration, unlock the worker node and you are ready to use your new SR-IOV interface in your pod application.
After the SR-IOV interface is successfully provisioned by above procedure, the next step is to create an NAD for its usage as following NAD.yaml file:
After the pod is successfully launched, you can exam its network resources by procedures as following:
$kubectl get pods -A
$kubectl exec -it <Your pod name from above cmd > -- /bin/sh
#ip addr
From the above complete working example, the whole concept of provision and use of SR-IOV inside the Kubernetes pod is illustrated. The StarlingX open source project made this complex task much easier to use.
The Internet of things (IoT) made rapid progress from a pure academic concept to play a crucial role in our daily life. From my point of view, the IoT applications can be classified into three categories:
Must have ones which change our lifestyle and ways people are living. Smartphones, connected through 5G/4G LTE network with location detection and other devices connected to the smartphone with their respective applications, apple watch, bluetooth sensors, remote secure monitoring , remote device control applications are good examples of IoT ecosystem in this category.
Nice to have ones, which improve our daily living qualities. Such as wearable IoT devices, Wifi, BT connected fridge, stove, microwave, hue BT based smart lights ambiances bulbs all belong to this group. They are nice to have, but not absolutely necessary.
The last category is the innovation one. It does not exist in our daily life, but with the emergency of such devices, our living habits can be changed and new business revenue modeling is realized. AI enabled drone devices, automatic driving cars and even meta devices can be put into this category.
But, do not neglect one of the most important devices, which play a central and non replaceable role in this overall connected mesh device network: your GPON FTTH home wifi modem. It can not only provide reliable wifi connection to your home with gigabit level up and download speed, but also can be the central equipment to integrate all those individual IoT applications into a single system which can be accessed globally.
Here are two of those IoT device deployment and application examples:
Deployment of GPON FTTH Home Router
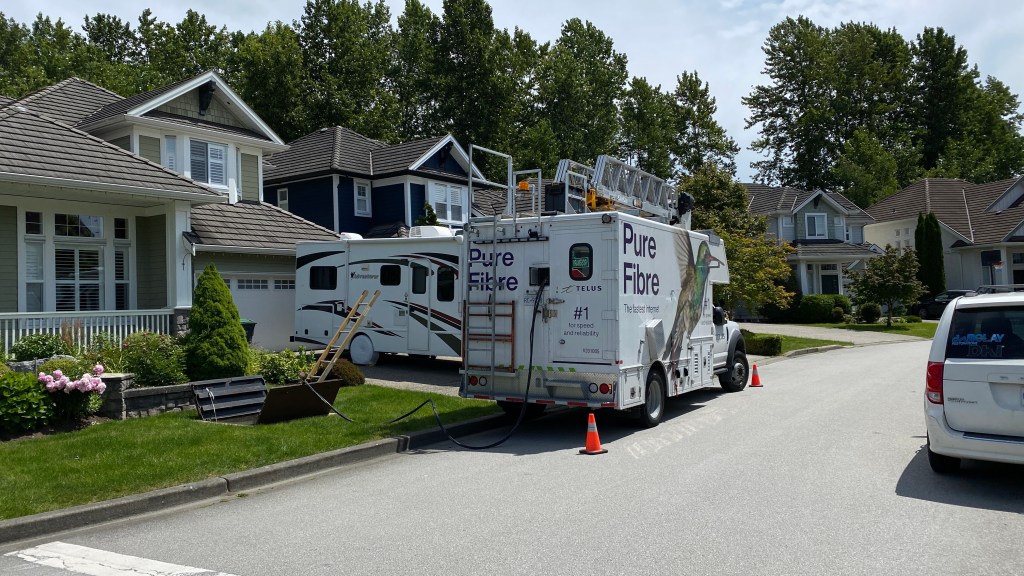
I just moved to a new property, there is no internet service yet. After I checked the wiring structure of the house, there is only a cable and phone outlet inside the house, no Ethernet outlet. I verified with the provider that FTTH service is available in my region. The big question in my mind: How will the FTTH be deployed and how can I get Ethernet service based on current wiring structure ? I actually noticed that there is one box beside the cable TV box outside the car garage and was assured this is the fiber cable box for the FTTH service. Here is how all those doubts are answered while I followed the whole FTTH service deployment process.
Connect the Fiber Box to the service center
The technician first connected the fiber box outside of the garage with the provider’s last mile terminator splitter and verified that the optical signal is good enough from the fiber box to the splitter with a optical signal monitor and loopback device.
Now, the physical optical connection from the central office to my house is done. Next step is to install the GPON terminal box with the SFP plugin. The techanin scans the barcode on the side of SFP device and add it to the provider CPE database to activate the device:
After all those, connect the TV cable compatible outlet from above network access hub to the TV cable box outside the garage. Oh !, suddenly I understood that the existing TV cable wiring structure will be used to provide the FTTH service to the house. SMART!
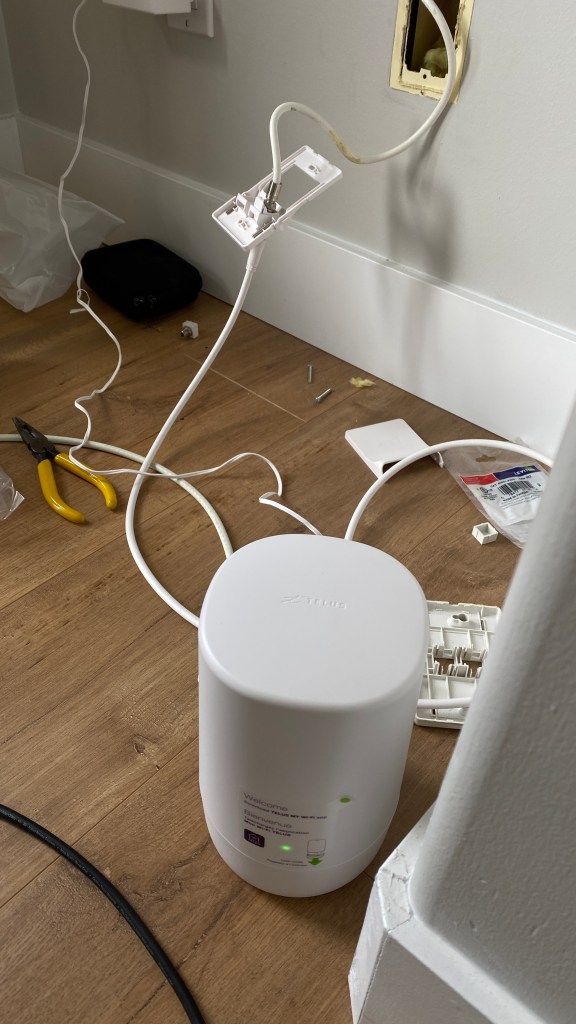
Now, go inside the house, pick up the TV cable outlet, which has been arranged to connect with above FTTH terminal box, finally connect the wireless modem with TV cable to the outlet:
After all those, you have WIFI service to the house with FTTH GPON at backend. Existing cable TV wiring structure is used for connection purposes. No Ethernet wiring is needed. On the back of the above wireless modem, there are a couple of Ethernet ports, which can be used to provide wired Ethernet connections to the devices like PC, smart TV and so on.
Then, the technician scans the above modem device’s barcode, adds it to the provider CPE database, verifies your account and you have both wifi and Ethernet service within the house. I also asked the technician to install a TV cable to Ethernet converter in the basement, so I can use the wired Ethernet function in the basement. Even without an Ethernet wiring structure, I also have an Ethernet outlet in the basement. Wow!
The service was down somehow the next day. I called the technical helpline, and the technician working with me did an online remote loopback testing to make sure everything is fine. The remote loopback test was passed and my modem can be remotely put into reset, reboot and whatever device testing from the provider’s remote central office.
Up to this moment, it has been an enjoyable experience. When worked on GPON FTTH technical project development in Nortel Networks about 10 years ago, I wrote the SFP driver, designed and coded the loopback testing procedures and implemented the service and device management system, such as put the device into service, out of service, monitoring the device with according alarms and so on, today I saw a ture, working deployment example of what we developed years ago. Existing !
Install and control multiple smart devices within home
With the gigabit upload and download WIFI and Ethernet service, different kinds of smart home devices are installed and put into service, including Amazon echo, smart doorbell, smart outlets, smart garage door opener, smart door lock, security camera and a lot of more devices and their according applications on my iPhone. Now, it is time to enjoy my new smart home environment. Here is a shot video I made to demo this kind of new smart home functions:
Modern applications are transformed to microservice based, API driven architecture. When the application is containerized, it needs to access other applications’ published APIs and K8s cluster API for its business logic.
In this article, an python application is containerized, its container image is built and pushed into docker register, an kubernetes manifest is created and deployed into K8s cluster and the containerized python application will access K8s cluster APIs to get cluster’s deployed pods’ configuration information. Each application running within containers of pods needs to be authenticated and authorized by K8s API server before each API access. When the application is containerized and deployed into Kubernetes cluster, each pod belongs to a specific namespace with its according service account (SA). Each service account has its own authentication secret, which can be used to authenticate with K8s API server. Role Based Access Control (RBAC) can then be used to control the authorization of associated service accounts. This service account secret is mounted to a pre-configured path, which can be accessed by the application running within the pod. The Kubernetes python package hides all those details from user python application code to make all those complicated processes easier to achieve.
Step One: Build the container image for the python application
Create a Dockerfile with following content :
controlplane $ cat Dockerfile
FROM ubuntu
RUN apt-get update
FROM python:latest
RUN mkdir /src
COPY . /src
WORKDIR /src
RUN pip install -r requirements.txt
controlplane $ cat requirements.txt
Kubernetes
Create following python program in the same directory of above Dockerfile based on this example:
from kubernetes import client, config

def main():
    config.load_incluster_config()

    v1 = client.CoreV1Api()
    print("Listing pods with their IPs:")
    ret = v1.list_pod_for_all_namespaces(watch=False)
    for i in ret.items:
        print("%s\t%s\t%s" %
              (i.status.pod_ip, i.metadata.namespace, i.metadata.name))

if __name__ == '__main__':
    main()
Then, build the docker image and push it to the docker registry:
controlplane $ docker build -t podapiaccess:v1 .
controlplane $ docker tag podapiaccess:v1 twintiger/podapiaccess:v1
controlplane $ docker login
Login with your Docker ID to push and pull images from Docker Hub. If you don't have a Docker ID, head over to https://hub.docker.com to create one.
Username: <Your Docker Registry User Name>
Password: <Your according password>

Login Succeeded
controlplane $ docker push twintiger/podapiaccess:v1
The push refers to repository [docker.io/twintiger/podapiaccess]
084f4d130a72: Pushed
d32ebda4ee0b: Pushed
db8d0fe6cf95: Mounted from library/python
00901a4c6fc7: Mounted from library/python
7e7decd61f68: Mounted from library/python
aedcb370b058: Mounted from library/python
c3a0d593ed24: Mounted from library/python
26a504e63be4: Mounted from library/python
8bf42db0de72: Mounted from library/python
31892cc314cb: Mounted from library/python
11936051f93b: Mounted from library/python
v1: digest: sha256:795b7425e878f4478147a6c136eba6994fc0113cf8c7537fbe42954fb1257582 size: 2631
controlplane $
Step Two: Test the newly built docker image
Test the above docker image by following steps:
controlplane $ docker run twintiger/podapiaccess:v1
Unable to find image 'twintiger/podapiaccess:v1' locally
v1: Pulling from twintiger/podapiaccess
0e29546d541c: Pull complete
9b829c73b52b: Pull complete
cb5b7ae36172: Pull complete
6494e4811622: Pull complete
6f9f74896dfa: Pull complete
fcb6d5f7c986: Pull complete
290438add9da: Pull complete
ab11df61f44a: Pull complete
de4793a5fa46: Pull complete
b7c69d9f5717: Pull complete
4d8c3388b53a: Pull complete
ceea8c40c3ea: Pull complete
Digest: sha256:5c800bd260a1cea55d71c4454166c49597c8f35d3520eadf7e82e8643f198cbf
Status: Downloaded newer image for twintiger/podapiaccess:v1
Traceback (most recent call last):
  File "/src/podapiaccess.py", line 16, in <module>
    main()
  File "/src/podapiaccess.py", line 5, in main
    config.load_incluster_config()
  File "/usr/local/lib/python3.10/site-packages/kubernetes/config/incluster_config.py", line 121, in load_incluster_config
    try_refresh_token=try_refresh_token).load_and_set(client_configuration)
  File "/usr/local/lib/python3.10/site-packages/kubernetes/config/incluster_config.py", line 54, in load_and_set
    self._load_config()
  File "/usr/local/lib/python3.10/site-packages/kubernetes/config/incluster_config.py", line 62, in _load_config
    raise ConfigException("Service host/port is not set.")
kubernetes.config.config_exception.ConfigException: Service host/port is not set.
controlplane $
Based on the above testing, the python code failed. Why ? The authentication with K8s API server failed. There is no corresponding authentication secret which is needed for the python application code to be authenticated with K8s API server.
This piece of python container code must be deployed into Kubernetes cluster, running from pod to make authentication process success.
Step Three: Deploy the containerized python application inside Kubernetes cluster
Deploy above manifest and verify its status by following procedures:
controlplane $ kubectl apply -f deployment.yaml
deployment.apps/hello-k8s-api created

controlplane $ kubectl get pods
NAME                             READY   STATUS    RESTARTS   AGE
hello-k8s-api-5769fb66fb-gtb2f   1/1     Running   0          29s
When microservice oriented applications are deployed into Kubernetes orchestrated cloud platform, the security model works well in traditional enterprise application deployment workflow will face a lot of new challenges and needs to be transformed and microservice friendly also.
To achieve end to end application level security needs coordination between different components within your cloud cluster: From platform software bootstrapping, operation system installation, system software patching and upgrade, user authentication and authorization, certificate management, network policy, application traffic rate limiting, policy agent, ingress and egress traffic control to name a few.
Start from platform software and keep it updated
Using technologies such as secure boot with signed operation system image, secured container images repository and signed docker application images to bootstrap your platforms within the cluster. Keep it secure and away from vulnerable security hacking by constantly updating and patching your whole cloud platform infrastructure. Deploy HA enhanced control plane to increase overall Kubernetes cluster availability. Use CEPH CSI backend to enhance data availability in your cluster.
Monitor your cluster system containers, application containers, storage, computing and networking resource utilization, performance with toolset such as ELK stack to warn, log and debug possible cluster system and application level issues.
Keep your certificate and secret safe
There are a lot of certificates used in the modern Kubernetes cluster: Kubernetes root CA, docker image repository CA, ETCD root CA, multiple system application root CA and so on.
Keep those CA and Kubernetes clusters secret safe using ways such as TPM hardware, Key Management System (KMS) to store the key remotely and encrypt your system disk, kubernetes system database content to avoid physically stolen hardware information leak.
Expire and renew those certificates periodically with the help of open source solutions such as certificate manager.
Deploy suitable user and account authentication and authorization mechanism
RBAC is the fundamental mechanism to achieve user, group and internal service account authentication and related authorization. You can define roles, cluster roles and bind those roles with certain users, groups and internal service accounts used by pods when those are deployed.
PSP (Pod Security Policy), its replacement: PSS(Pod Security Standard) and OPA (Open Policy Agent) can be used to enforce the security policies before a Pod can be allowed to be deployed into the cluster.
Control cluster network traffic with network policies
Besides the pod security policy, user and user group authentication and authorization, network policy can be used to control its network traffic behaviors: allow some kind of network TCP/UDP of certain ports, deny some of network traffic in both ingress, egress direction.
Decouple application with underlining network layer functions using service mesh
Service mesh can be used to decouple the application logics and its underline networking layer related control and monitor functions, such as rate limiting, service call trace, mTLS security realization.
Others
Besides above, other must-have mechanisms to secure your cluster includes using secured, trusted application container image repositories, signed container images, and highly available infrastructures to name a few.
Summary
There are multiple ways to secure your cluster. Balancing the security rigidness and ease of use is a real challenge in day by day cluster operation.
When you virtualized your infrastructure or applications in form of IaaS, PaaS and SaaS using virtual machine or containers, you gain a lot of benefits: easy to deploy, low CAPS, quick application deployment , load balanced based high availability, better resource utilization through sharing, open to 3rd party open sourced new technologies and so on. You also need to consider what the new environment means for your application: your application is sharing the underline cloud-based computing, networking and storage resources with an unknown number of other applications. The delay between client and server communication will be longer compared with the traditional way deployed through a dedicated hardware server.
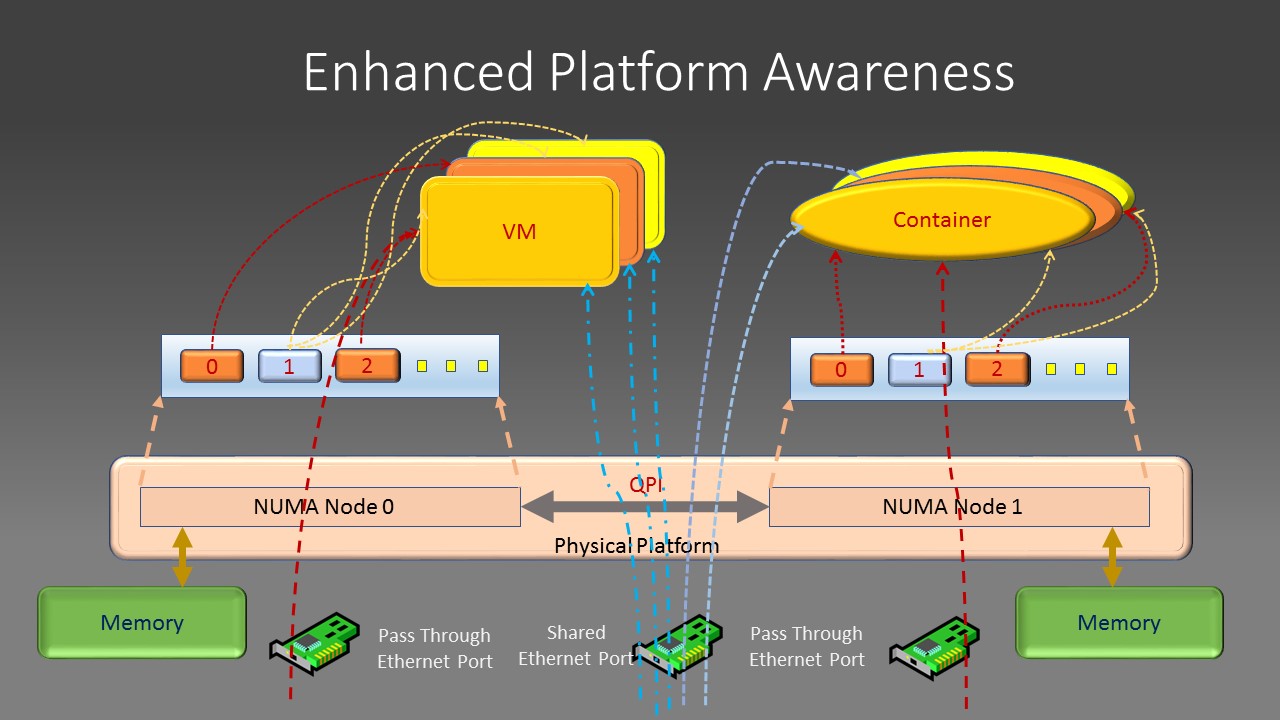
EPA (Enhanced Platform Awareness) can help to improve the performance of crucial applications. It did this by allocating dedicated computing resources including cpu cores, memory page, cache memory, dedicated networking interface resource to the VM or container and giving the exclusive usage of those resources to those performance sensitive crucial applications. After those reservations, the rest of platform resources can be shared between other virtual machines and containers.
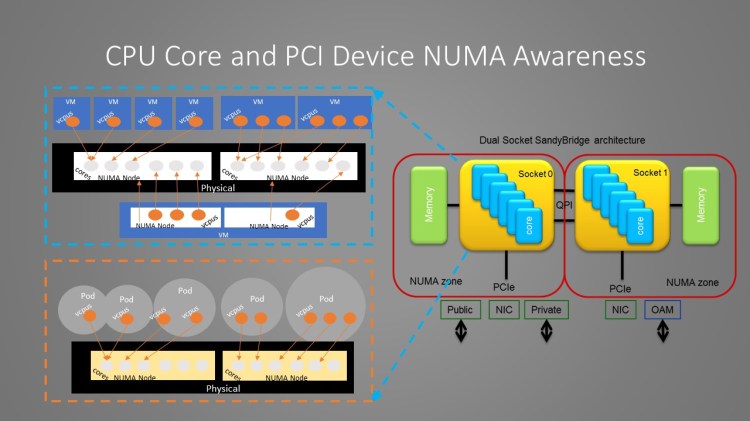
In modern Intel Xeon architecture, there are multiple CPU sockets, each with multiple cpu cores, each socket has its directly attached memory chips, PCI devices (PCI NIC card, GPU, co-processors). This is called NUMA(non-uniform Memory Architecture) in Intel’s term. EPA is realized to reserve a certain number of dedicated cpu cores to run your application and pin those cores to be co-located in the same socket where the memory, cache and network interface PCI card your application running from are all attached to the same cpu socket or NUMA node. This will give your application the best performance. Of course, applications can use resources such as memory, PCI devices attached to other CPU NUMA nodes. But, the side effect is that all data packets and memory access must go through the mesh connectors between different sockets: the QPI interface, which has capped bandwidth and this will become the performance bottom neck of your applications . The EPA principle can be illustrated by following diagrams:
By apply EPA principle, you assign dedicated CPU cores to virtual machine or container, assign dedicated memory, dedicated PCI device attached to the same cpu socket or NUNA node, passing through Ethernet card or its SR-IOV functions directly to those virtual machines or containers to guarantee the exclusive usage of those resources. You can also isolate VM or container cache allocation to avoid its content being evicted or inspected by another VM or container from both performance and security point of view.
How to achieve EPA ?
First of all, You can use following commands to find your platform’s CPU core, memory, network CPI device and its associated NUMA node information to gain a whole picture of your compute platform’s resources:
$cat /proc/cpuinfo
$lspci |grep Network
(Get Network NIC PCI Bus ID)
$cat /sys/bus/pci/devices/<NIC-PCI-Bus-ID>/numa_node
For allocating dedicated cores, memory and so on to OpenStack VM, flavor for virtual machines is used to define how many, which NUMA node the cores will come from, which cores on a specific CPU socket is used for reserved, dedicated purpose, specify the affinity requirement between virtual machine and NUMA node’s PCI devices. After that, launching a virtual machine using this flavor can guarantee those resource allocation for your virtual machine application. For example, set your OpenStack flavor as following:
openstack flavor set --property hw:cpu_policy=dedicated vm-flavor
openstack flavor set --property hw:numa_nodes=2 vm-flavor
openstack flavor set --property hw:numa_node.0=1 vm-flavor
openstack flavor set --property hw:numa_node.1=0 vm-flavor
openstack flavor set --property hw:numa_cpus.0=0 \  hw:numa_cpus.1=1,2 vm-flavor
openstack flavor set --property hw:numa_mem.0=1048576 \  hw:numa_mem.1=1048576 vm-flavor
openstack flavor set --property hw:mem_page_size=1024 vm-flavor
openstack flavor-key vm-flavor hw:pci_numa_affinity= strict
openstack flavor set vm-flavor --property "pci_passthrough:alias"="<PCI device alias name:Num of Device>"
The above flavor defined two virtual NUMA nodes. The virtual NUMA node 0 is mapped to physical NUMA node 1 and virtual NUMA node 1 is mapped to physical NUMA node 0. Virtual node 0 has one dedicated core coming from core number 0 from its underlying physical NUMA node. Virtual NUMA node 1 has two cpu cores mapped to core number 1 and 2 of the physical NUMA node. Each virtual NUMA node will have 1 Gb memory with a page size of 1024. The VM must be scheduled on NUMA cores with a direct PCI network device attached to it. The network PCI device is passed through to the VM directly when you launch the VM with command like:
openstack server create --flavor vm-flavor --image <ID of Image> <Name of VM>
After cores are reserved for the virtual machine, the application running within it can check the available cores by routine like: sched_getaffinity() by code or look at the content of file: /dev/cpu and /proc/cpuinfo directory.
For containerized applications orchestrated by Kubernetes, achieving EPA is relatively easier due to the fact that Kubernetes uses a declarative way for deployment. You can use yaml file to define the desired state of your application, specify the replicate number of containers running your application, which image to run your application from, the number of cores, memory size required directly. For SR-IOV devices reserved for your application to use exclusively, you need to provision those resource first by using the “NetworkAttachmentDefinition” with a name and according parameters as following example:
During the Pod definition stage, annotation metadata will be used to attach SR-IOV resource to the pod network namespace. Application pod’s core, memory request and SR-IOV network device reservation will be specified within container’s resource definition session per following code snippet:
The above declarative Kubernetes manifest deployed three copies of your application pod running from centos image with 10G memory, 4G of 1G size of huge page and one SR-IOV backed network interface. After the container is running, the code within the container can parse /sys/fs/cgroup/cpuset/cpuset.cpus for cpu related information and check huge page and network related information as normal.
In the cloud computing field, there are already a lot of open sourced or private automation tools and infrastructure solutions such as Ansible, Chef, Puppet, OpenStack, Kubernetes. There are many on-premise or public cloud providers available for your infrastructure and applications. People asked why we need more orchestration solutions ?
What is Infrastructure Orchestructure ?
It is sometimes called orchestrator for orchestrator. True, you can all think OpenStack, Kubernetes, AWS, GKE, VMWare are all kinds of orchestrators and meet your cloud native application deployment requirements to some degree.
The Infrastructure Orchestructure is system wide orchestrator and using OpenStack, Kubernetes, VMWare, AWS and so on as underlining orchestrators to deploy system wide business applications across multiple cloud providers, multiple regions and heterogeneous underling technologies.
Why do we need it ?
Business cloud native applications need to deploy over hybrid clouds, over different underlying technologies. It needs an end to end, full scale Infrastructure as Code solution. That is what the Infrastructure Orchestrator provided.
How to do end to end Orchestration ?
Two types of solution exit for this requirement. One is a private solution such as Terraform from HashiCorp and the other one is open sourced, OASIS TOSCA (Topology and Orchestration Specification for Cloud Applications) template based solution by companies like Cloudify. All those realized the so-called Infrastructure as Code method.
Want to know each one’s strengths and best suitable use cases, here is quick discussion on this topic. Personally, I prefer the Cloudify solution for its open source characteristics, full scale capacity and more applicable to the VNF field.
Now, let’s take a little bit explanation of Cloudify solution architecture as illustrated by following diagram:
Source: Cloudify.co
Basically, you code your infrastructure as code in yaml TOSCA template. The Cloudify rendering engine will start from there to deploy your solution end to end crossing multiple cloud providers. It will also take care of the tasks such as healing, scale up and down your end to end cloud resources based on business requirements.
Let’s break the gap between theory and real use cases using a trivial demo. Here, we have a deployed, working OpenStack cloud and I will use Cloudify solution to deploy an application over it. In a more real deployment scenario, your application can deploy over hybrid cloud, different public cloud (AWS, GKE, VMWare . . .), mix of VM, Containers, Bare metal, SDN and so on, end to end, automatically using a TOSCA template. This saves the hassles of deploying business applications needed by individual cloud providers one by one and then connecting those segmented pieces of solution into one end to end solution manually. Here is the summary of demo steps:
Log into deployed, working OpenStack cloud through Horizon GUI interface to exame its deployed resources. The existing resources include private and public networks, Neutron router to connect those two network segments, VM image. But, there is NO VM deployed already.
Log into Cloudify GUI interface, load TOSCA OpenStack plugins. You can think of plugin as the abstraction layer between the TOSCA engine and underlying, deployed clouds. By this way, the same application can be deployed over any popular public or private cloud such as OpenStack, AWS, GKE and so on to achieve cloud agnostic.
The next step is to load the network blueprint and deploy it. Blueprint is the modeling template for your system, network and application. You can open the blueprint with any editor to view its content.
Cloudify displays the deployment model itself and creation progress in a graphic way.
Go back to OpenStack Horizon interface to check the new OpenStack resources created from network TOSCA template: new network segments, router are created. You can compare the network topology after and before the TOSCA template is applied there. There is no VM yet.
Load application blueprint after the success deployment of network blueprint. After that, the VM running your application and its corresponding floating IP address is successfully deployed.
You can then use the floating IP to access your application.
Here, we used the TOSCA modeling template, successfully deployed our application over OpenStack cloud.
CNCF recommends four steps to achieve cloud native for your application:
Containerization of your application through Docker and push its image into registry
Setup CI/CD pipeline for DevOps automation
Using orchestrator such as Kubernetes to manage the full application life cycle
Add observability and analysis capacity to your deployed application
Add building block such as ingress, service mesh to enhance security, traffic control, tracing capacity to deployed application
Let’s start from scratch to achieve those goals using Microsoft Azure public cloud. At the end of this demo, you will have a deployed, containerized service running in a public cloud meeting above CNCF criteria.
Deploy a Kubernetes Cluster in Azure
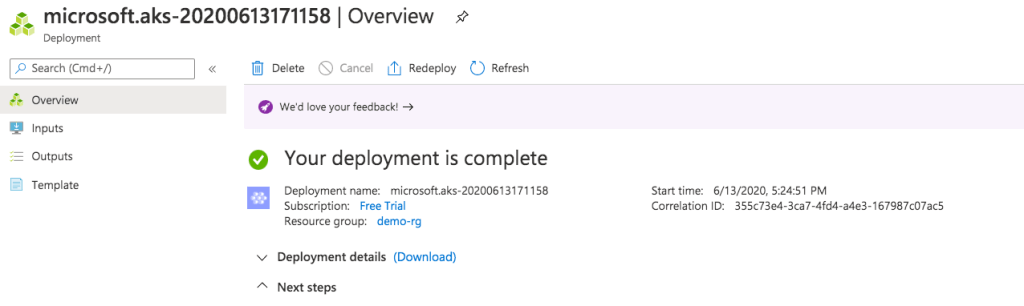
This can be done either using Azure CLI or its GUI interface following a couple of easy steps. Here is the deployed Kubernetes cluster inside my Azure account using GUI interface from the quick start session:
Follow those GUI easy steps, select your cluster name, create a resource group, networking method and so on, you will have your Kubernetes cluster ready to use.
After your Kubernetes orchestored cluster is ready, go to its CLI to use your familiar command like kubectl to exam your cluster:
Deploy a containerized Application
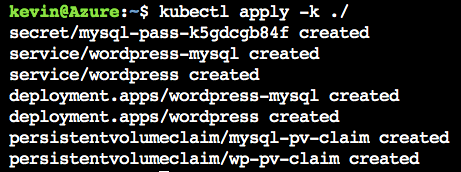
Now, let’s deploy a containerized wordpress application inside the Kubernetes cluster following this procedure: wordpress application and it works without any issue. Here, containerized wordpress application, associated database, persistent volume are realized through Azure CLI command using kubectl. The service type used during this deployment is load balancer and you will get an routable IP address to access your service after those procedures.
Verify your wordpress application is up and running using the global IP address assigned to WordPress service:
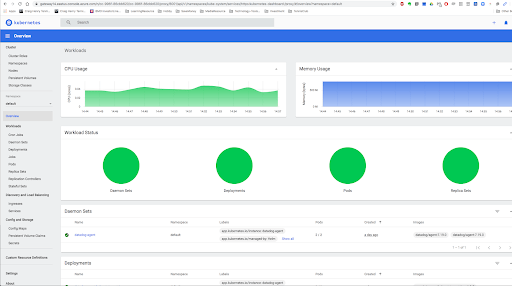
Install Kubernetes dashboard to your cluster to add basic monitoring capacity by following step:
Get the global web address and according sign in token; then go to this web page, select sign in with token:
From there, you can do normal cluster administrative tasks through this GUI interface.
Add Cluster Monitoring and Visibility Facilities
There are built-in monitoring features inside Azure infrastructure such as Logs, Metrics, Insights, which can be accessed from your Azure portal:
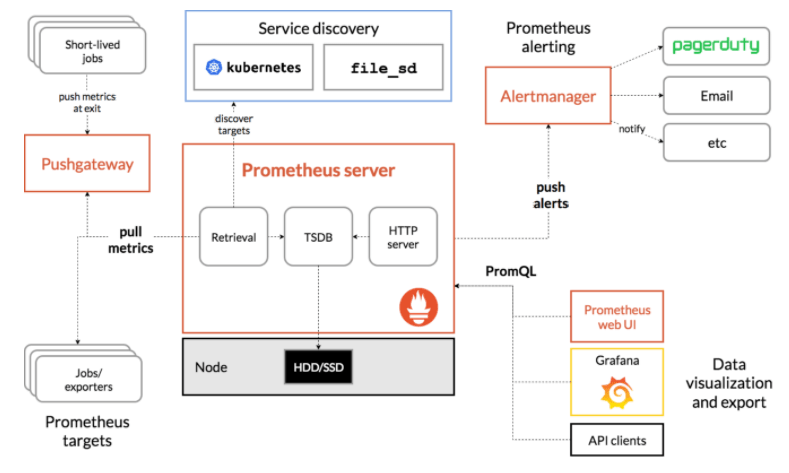
Besides that, I tried to install and use two other Kubernetes cluster monitoring solutions in the above cluster: the managed solution from datadog and the open sourced one: prometheus with grafana. Those all rely on Kubelet cAdvisor, metrics server and kube-state-metrics component to scrape raw data from node, kubernetes itself, its deployed pods and applications running over it.
Helm is used to installed datadog agent inside the cluster by those steps and the containerized Datadog agent is deployed as a Kubernetes daemonset:
Verify datadog agent is successfully installed on your cluster from Azure CLI:
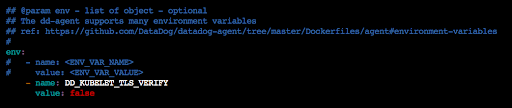
For quick testing purpose, disable TLS authentication with Kubernetes API server for Datadog by update Datadog helm chart’s values.yaml and update Datadog agent with helm upgrade command in order to make the Datadog agent to work:
Go to your datadog web portal, select your cluster, you should be able to see your cluster related metrics:
Let’s install the popular open source monitoring tool: Prometheus and its Grafana dashboard.
Prometheus and Grafana Helm charts can be used to finish those two installations pretty easy and straightforward. Within helm git repo downloaded before, those Helm charts have been downloaded already. Follow those simple steps, you can install both tools from Azure command line:
Make sure to expose prometheus as a load balancer type of service to let Azure assign it a routable IP address. Then, you can access prometheus build in dashboard through that IP address with port 9090:
Use similar step to install Grafana dashboard from its helm chart, expose its service as load balancer type and you can access Grafana dashboard from Aure assigned routable IP address:
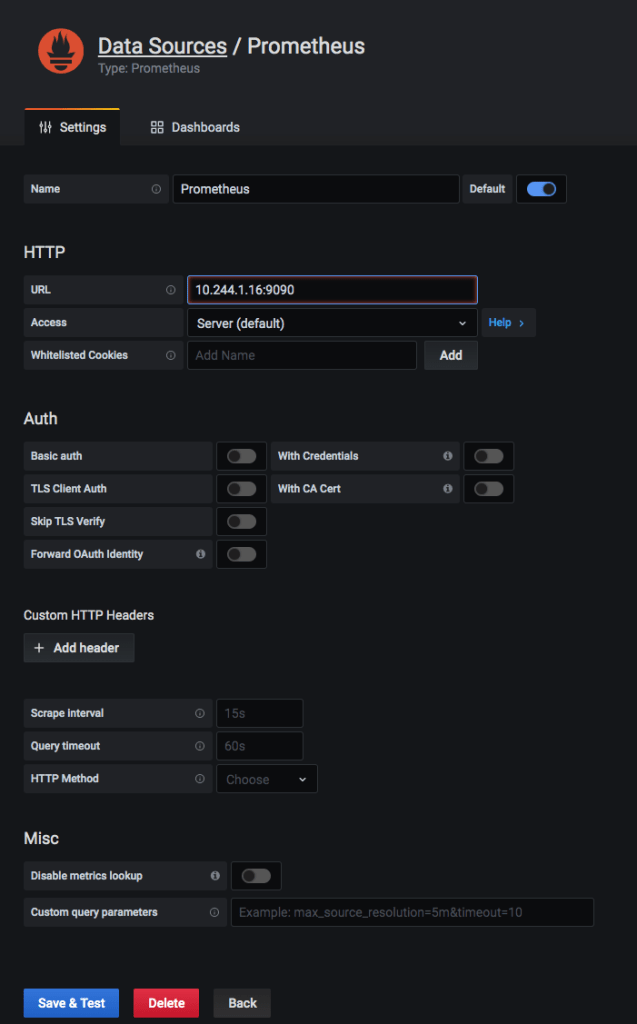
Add prometheus type data source to Grafana:
Go to Grafana web page to download a dashboard examples, for example, dashboard number 11802, import it into Grafana through GUI to start your cluster monitoring:
In order to let Prometheus to monitor your application besides the infrastructure components, you have to add prometheus data feeding capacity into your containerized application by using its SDK library, instrument your application with prometheus.io/scrape: ‘true’ and prometheus.io/port” ‘9090’ annotations. For example, by following yaml descriptive file, you can deploy a service with its according deployment with above annotations to monitor the performance specific to your deployed application.
Add Service Mesh and Ingress to your Cluster
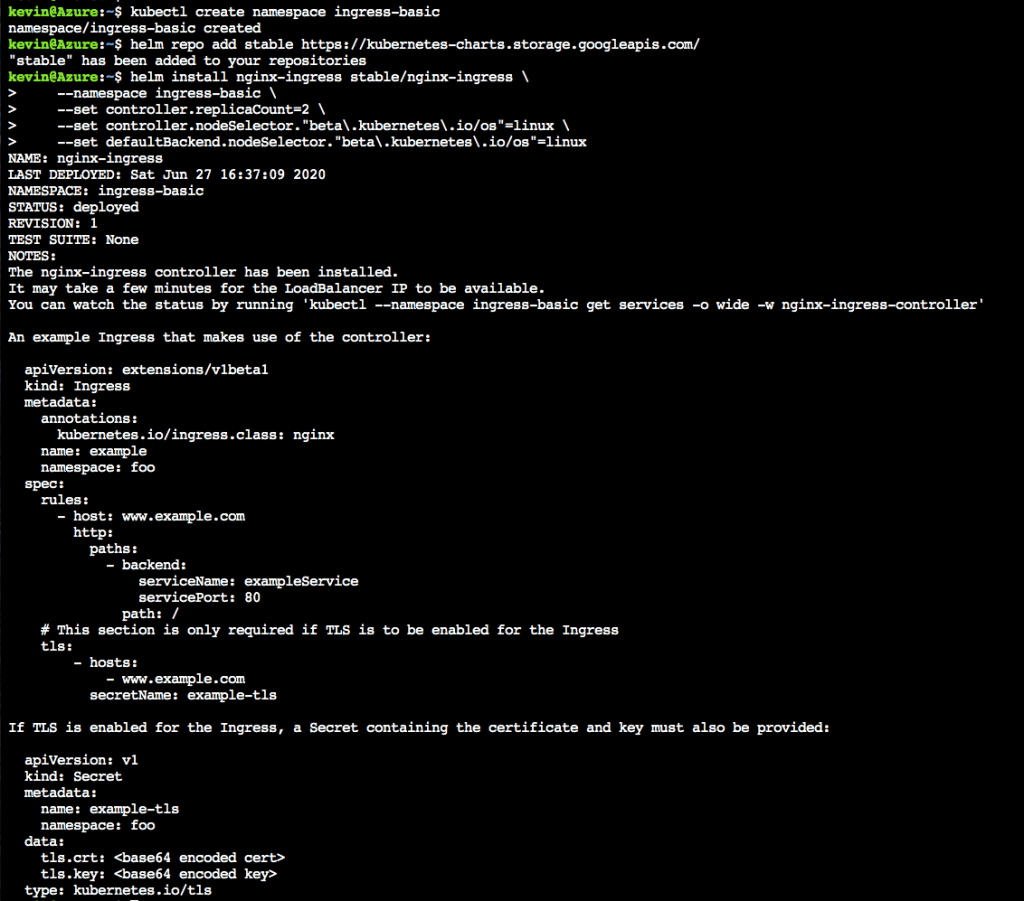
Service mesh solutions, like Istio, can be used to provide an infrastructure layer for the deployed micro service applications, decouple the application function with underlying infrastructure functions, discover, monitor and track deployed application, secure and rate limiting communications between services, through non instrumented sidecar mechanisms. Its installation on Azure is well documented by Azure AKS user guide. Same as installing an Ingress controller for your cluster, which can provide layer 7 application traffic routing and reverse proxy functions. I finished all those components’ installation without issues by following those installation guides: Istio service mesh inside Azure and Ingress Controller inside Azure. After the installation, you can play with some of the reverse proxy application routing examples. Here are some steps I captured during this process:
Use CI/CD Pipeline
Azure has built-in CI/CD solution by setting up a DevOps project following “Create a CI/CD Pipeline with Azure DevOps Projects” from its quick start session if you develop your application using .NET, Java, Python, PHP, Node.js. It has the basic features such as auto release building upon new code check in, auto testing and deliver. But, for more advanced features, you have to use open source tools like Jenkins/Jenkins x/Spinnaker and even bring in service mesh solutions for advanced canary release, rolling update of your microservice applications.
Summary
Through the above procedures, a full cycle of CNCF recommended work flow is achieved using Microsoft Azure public cloud.
Multiple cloud Virtual Infrastructure Manager (VIM) exists for cloud infrastructure, such as OpenStack, Kubernetes, Kubeless, CloudStack to name a few. How to combine and utilize the best pieces from different solutions for the sake of faster cloud deployment, easy to manage, update and upgrade ? What’s the role of service mesh, API gateway will play for the overall cloud native application deployment architecture ? What are serverless functions ? How to achieve end to end visibility for your deployed cloud ?
For sure, no single solution can achieve all those goals. Stay tuned for this video I posted in Linkedin originally to understand technologies, solutions addressing those challenges.
Digital transform will change the way of code development, service delivery, daily working style and more. How do we adapt to this change? We need to adopt a batch of new technologies, culture changes and promote new best practices.
From a technology point of view, a shift from monolithic way of development to cloud native, microservice based, containerized and orchestrated applications will be the first step. This transform will bring benefits with challenges: How to gain the end to end observability of tens to hundreds of, constantly migrating distributed services running from containers? What about everyday emerging new tools, open source solutions? How to handle more serious security issues with this new architecture? and lots of more questions.
I just attended the 2020 F5/Nginx virtual Agility conference and found those are common questions and concerns from the industry, technology community. F5/Nginx solutions have some very nice products and solutions for those concerns and let me share my comments on those.
Culture Change and Solution Architecture
The transformation starts from company culture change. F5 promoted 7 principles driven all their product development cycle, Which I can not agree more: Application first, multi cloud compatible / platform independent, API first, integrated with AI and end to end analytics and visibility, build in security, reusability with modular design and the last one: open source at core.
Here is the architecture diagram taken from the conference which best describes above culture change:
First of all, the code can be run in any cloud: public cloud like AWS, GCE or private cloud, communication between different services is using declarative APIs, security is built into every level of application from application level using WAF (Web Access Firewall), infrastructure level using ingress controller, service mesh, DDoS service. Telemetry is provided for all the components and full data path with integration of open source based toolsets. You get a single pair of glass views of your services from end to end with one integrated control plan. AI is used to enhance the security algorithm and service routing. With this architecture, DevOps,SecOps,AppDev and NetOps teams can do their jobs more efficiently within the same environment. That is pretty cool!
NFV/Telco Cloud needs Same Transformation
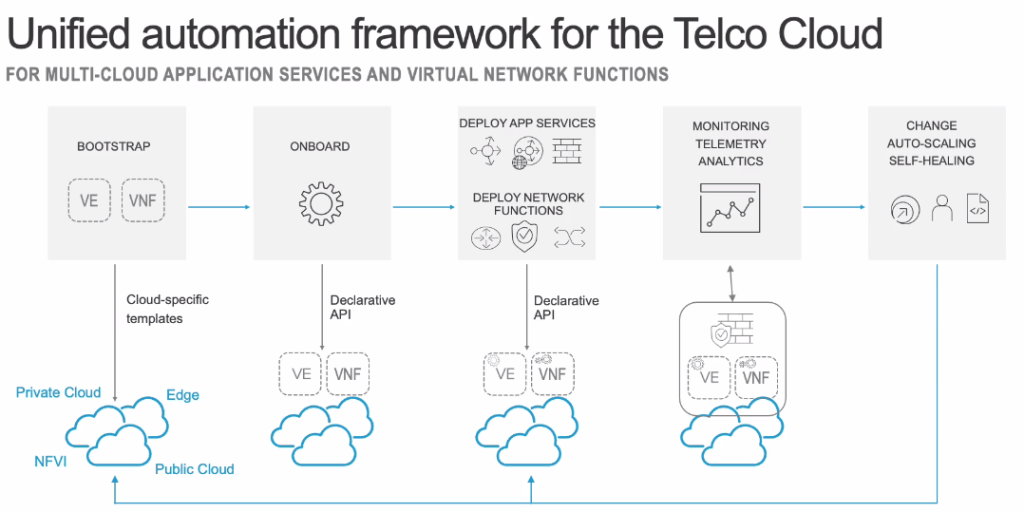
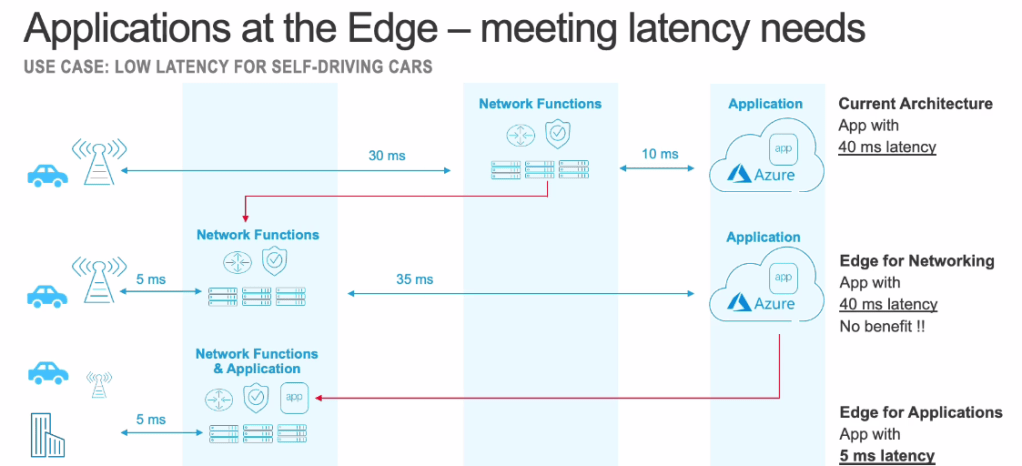
People usually think traditional IT service such as 3-tire based web application architecture is the best candidate for above digital transformation. Just like the message I got from the conference: The same transformation is coming for communication service providers. NFV is adopting containized implementation, moving close to the edge for 5G application latency concern, and migrating together with the application which consumes its collected data. This is illustrated by following diagrams:
The same 7 principles are carried out in Telco cloud with more emphasis to move containerized NFV to edge and migrate VNFs together with the applications using the data streams coming from it. Latency insensitive applications can still be hosted in traditional data centers while public cloud can be used to host other classic applications.
Actually, this already happened in the service provider world from core to edge NFV cloud. Project likes Airship from AT&T adopted container based, orchestrated architecture to take advantage of the same benefits from microservice infrastructure: agility, easy to deploy new release in CI/CD pipeline, auto scaling of services and resilience.
What I am still looking for?
All those services, solutions and architectures look pretty impressive. Things, I found missing to better facilitate this transformation, include:
Top to down telemetry integration: The above architecture provided end to end service application tracing, metrics, logs and so on. Most of those covers east to west traffic even with service mesh. API gateway North to South integration stops at infrastructure level. Customers still need to collect telemetry data from both the communication service provider and application provider to figure out the full North to South and vice versa picture. For example, using F5 tools, you found the packets are dropped in a queue and understood this was caused by underlying cloud infrastructure, there is no integration between those F5 toolsets with telco telemetry such as SDN opendaylight to dig out where the bottleneck is.
Still too many tools to choose from and master. F5 integrated a lot of open source tools and Nginx tools into their products. But, customers still have to use different tools from different products to fit for the best interestings of different application scenarios. If you are now using an open source or other 3rd party tool to do your daily business and those are not integrated, tested and verified with the F5 solution, we can only wish you best luck. It is not easy to DIY this without a steep learning curve and huge investment due to lack of expertise on those topics.
Overall, I am pretty excited about the solutions provided by F5/Nginx to help customers to speed up their journey to modernize their services to microservice based architecture with confidence and manageability.