
CNCF recommends four steps to achieve cloud native for your application:
- Containerization of your application through Docker and push its image into registry
- Setup CI/CD pipeline for DevOps automation
- Using orchestrator such as Kubernetes to manage the full application life cycle
- Add observability and analysis capacity to your deployed application
- Add building block such as ingress, service mesh to enhance security, traffic control, tracing capacity to deployed application
Let’s start from scratch to achieve those goals using Microsoft Azure public cloud. At the end of this demo, you will have a deployed, containerized service running in a public cloud meeting above CNCF criteria.
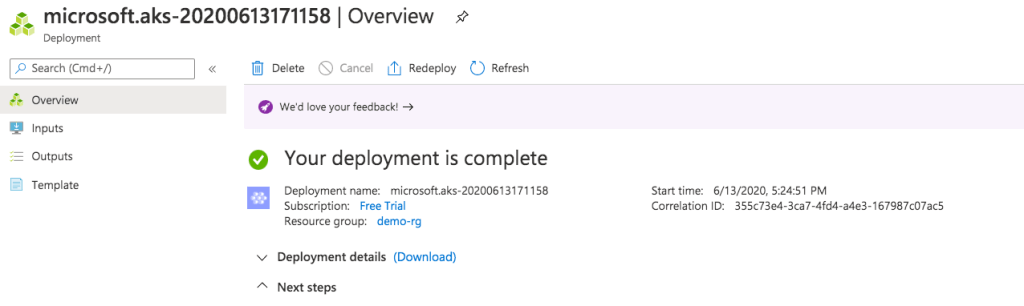
Deploy a Kubernetes Cluster in Azure
This can be done either using Azure CLI or its GUI interface following a couple of easy steps. Here is the deployed Kubernetes cluster inside my Azure account using GUI interface from the quick start session:

Follow those GUI easy steps, select your cluster name, create a resource group, networking method and so on, you will have your Kubernetes cluster ready to use.
After your Kubernetes orchestored cluster is ready, go to its CLI to use your familiar command like kubectl to exam your cluster:

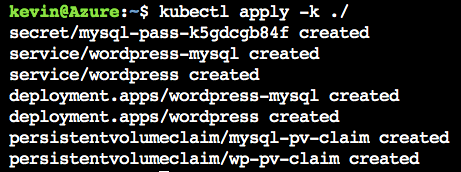
Deploy a containerized Application
Now, let’s deploy a containerized wordpress application inside the Kubernetes cluster following this procedure: wordpress application and it works without any issue. Here, containerized wordpress application, associated database, persistent volume are realized through Azure CLI command using kubectl. The service type used during this deployment is load balancer and you will get an routable IP address to access your service after those procedures.

Verify your wordpress application is up and running using the global IP address assigned to WordPress service:

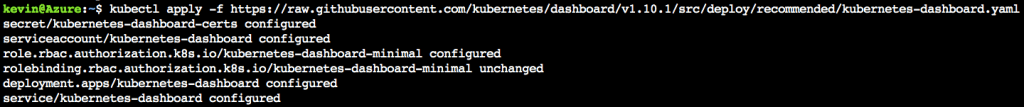
Install Kubernetes dashboard to your cluster to add basic monitoring capacity by following step:
Get the global web address and according sign in token; then go to this web page, select sign in with token:


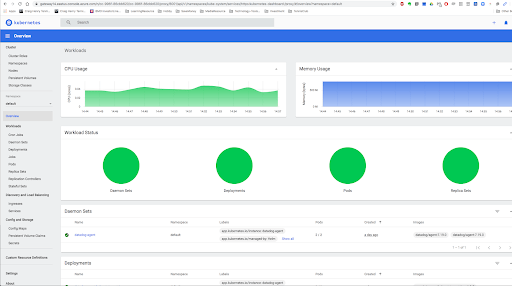
From there, you can do normal cluster administrative tasks through this GUI interface.
Add Cluster Monitoring and Visibility Facilities
There are built-in monitoring features inside Azure infrastructure such as Logs, Metrics, Insights, which can be accessed from your Azure portal:

Besides that, I tried to install and use two other Kubernetes cluster monitoring solutions in the above cluster: the managed solution from datadog and the open sourced one: prometheus with grafana. Those all rely on Kubelet cAdvisor, metrics server and kube-state-metrics component to scrape raw data from node, kubernetes itself, its deployed pods and applications running over it.
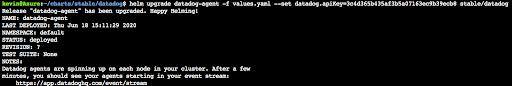
Helm is used to installed datadog agent inside the cluster by those steps and the containerized Datadog agent is deployed as a Kubernetes daemonset:


Verify datadog agent is successfully installed on your cluster from Azure CLI:

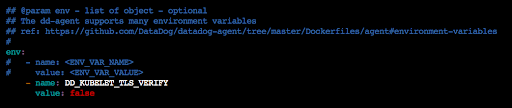
For quick testing purpose, disable TLS authentication with Kubernetes API server for Datadog by update Datadog helm chart’s values.yaml and update Datadog agent with helm upgrade command in order to make the Datadog agent to work:
Go to your datadog web portal, select your cluster, you should be able to see your cluster related metrics:

Let’s install the popular open source monitoring tool: Prometheus and its Grafana dashboard.
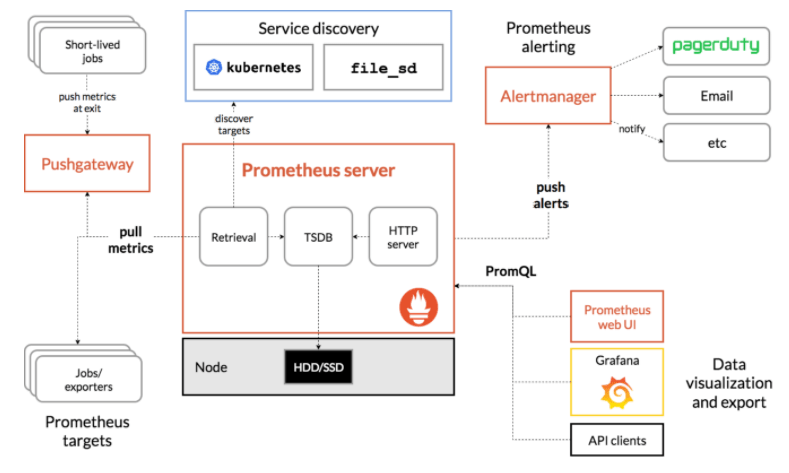
Source: https://prometheus.io/docs/introduction/overview/
Prometheus and Grafana Helm charts can be used to finish those two installations pretty easy and straightforward. Within helm git repo downloaded before, those Helm charts have been downloaded already. Follow those simple steps, you can install both tools from Azure command line:
kevin@Azure:~/charts/stable/prometheus$ helm dep update
kevin@Azure:~/charts/stable/prometheus$ kubectl ns create monitoring
kevin@Azure:~/charts/stable/prometheus$ helm install prometheus . --namespace monitoring --set rbac.create=true
Make sure to expose prometheus as a load balancer type of service to let Azure assign it a routable IP address. Then, you can access prometheus build in dashboard through that IP address with port 9090:


Use similar step to install Grafana dashboard from its helm chart, expose its service as load balancer type and you can access Grafana dashboard from Aure assigned routable IP address:

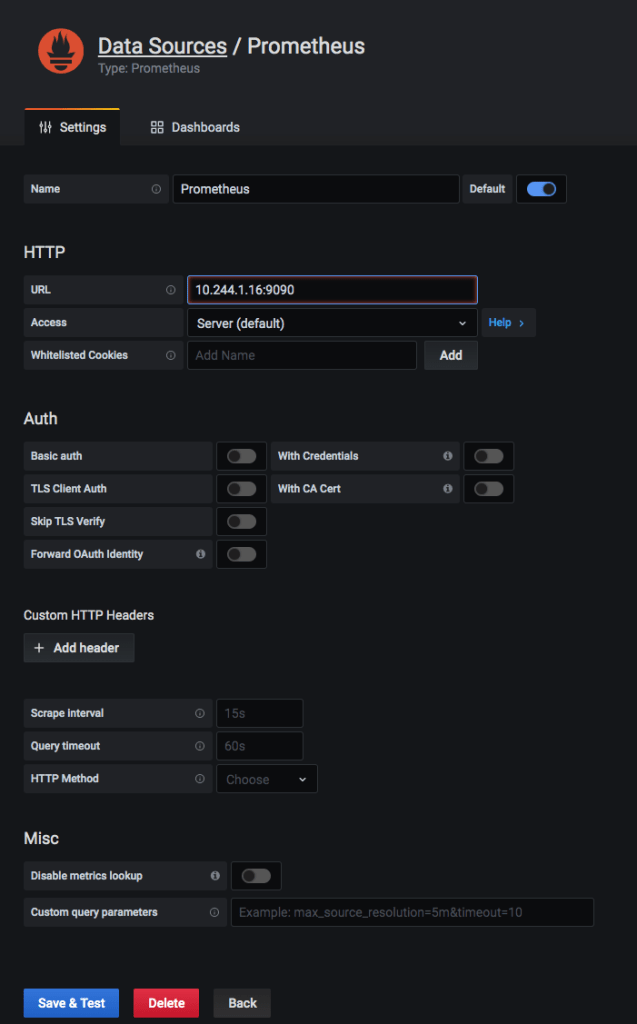
Add prometheus type data source to Grafana:
Go to Grafana web page to download a dashboard examples, for example, dashboard number 11802, import it into Grafana through GUI to start your cluster monitoring:


In order to let Prometheus to monitor your application besides the infrastructure components, you have to add prometheus data feeding capacity into your containerized application by using its SDK library, instrument your application with prometheus.io/scrape: ‘true’ and prometheus.io/port” ‘9090’ annotations. For example, by following yaml descriptive file, you can deploy a service with its according deployment with above annotations to monitor the performance specific to your deployed application.

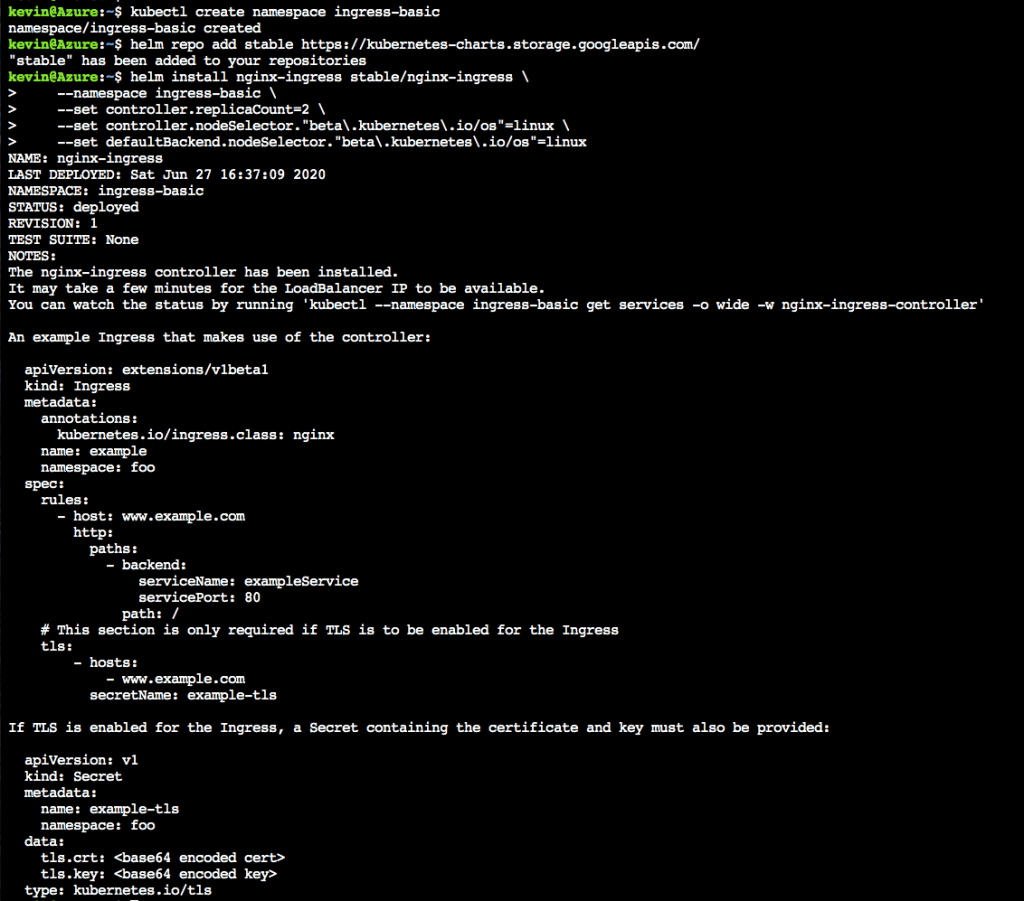
Add Service Mesh and Ingress to your Cluster
Service mesh solutions, like Istio, can be used to provide an infrastructure layer for the deployed micro service applications, decouple the application function with underlying infrastructure functions, discover, monitor and track deployed application, secure and rate limiting communications between services, through non instrumented sidecar mechanisms. Its installation on Azure is well documented by Azure AKS user guide. Same as installing an Ingress controller for your cluster, which can provide layer 7 application traffic routing and reverse proxy functions. I finished all those components’ installation without issues by following those installation guides: Istio service mesh inside Azure and Ingress Controller inside Azure. After the installation, you can play with some of the reverse proxy application routing examples. Here are some steps I captured during this process:

Use CI/CD Pipeline
Azure has built-in CI/CD solution by setting up a DevOps project following “Create a CI/CD Pipeline with Azure DevOps Projects” from its quick start session if you develop your application using .NET, Java, Python, PHP, Node.js. It has the basic features such as auto release building upon new code check in, auto testing and deliver. But, for more advanced features, you have to use open source tools like Jenkins/Jenkins x/Spinnaker and even bring in service mesh solutions for advanced canary release, rolling update of your microservice applications.

Summary
Through the above procedures, a full cycle of CNCF recommended work flow is achieved using Microsoft Azure public cloud.
